The brief
The project examined the UCI Online News Popularity dataset, originally collected from Mashable, to understand patterns associated with article sharing. The objective was not to manufacture a formula for virality. It was to give an editorial team a clearer view of performance, timing, content categories, and the limits of prediction.
Approach
I used Power Query to inspect, clean, and prepare the data, then built a six-page Power BI report around the questions an editorial team would actually ask:
- Which content categories generate the strongest typical performance?
- How does publishing day relate to sharing?
- Which article attributes appear related to reach?
- Are any individual features strong enough to predict success on their own?
Because share counts are strongly skewed by exceptional articles, the analysis pairs total shares with medians and distributions. That keeps high-volume outliers from becoming the whole story.
What the evidence showed
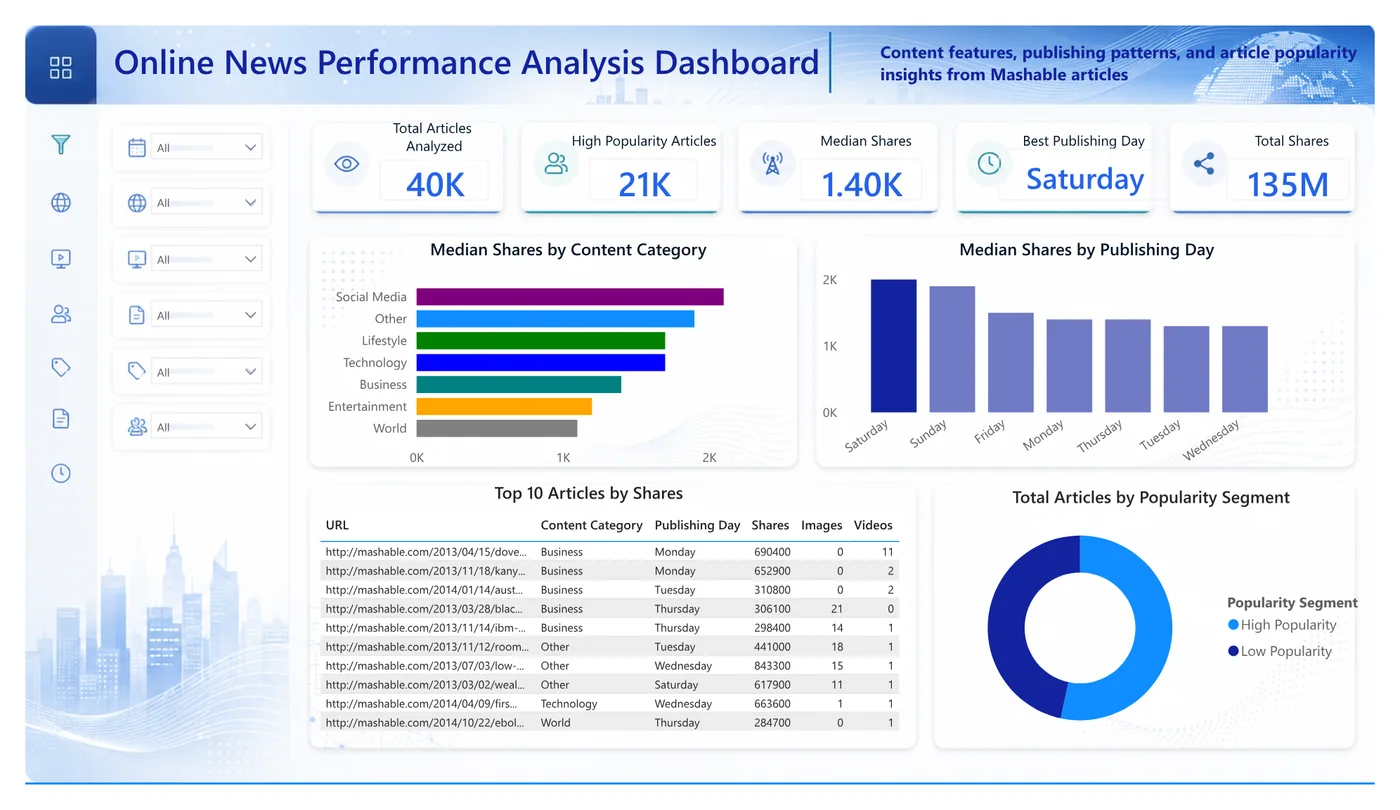
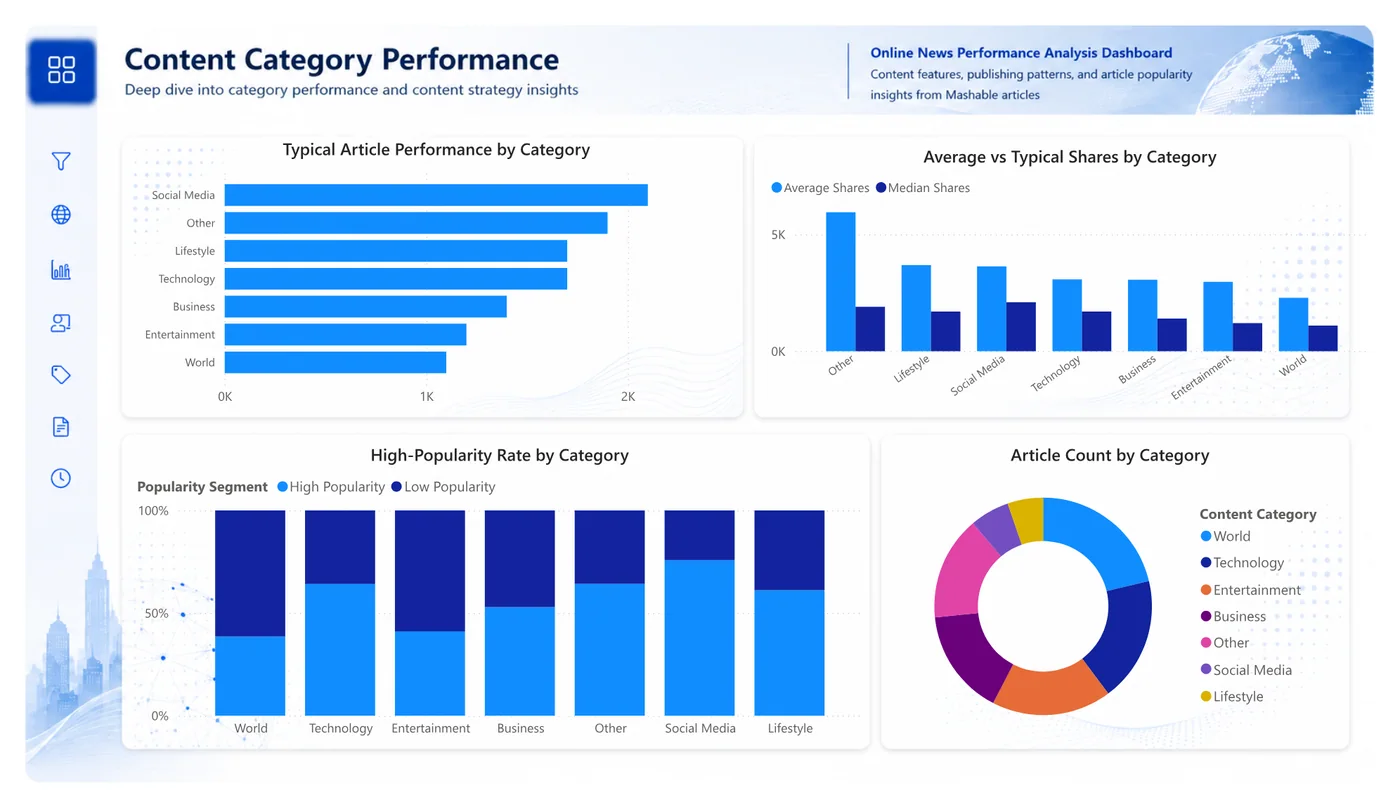
- Social-media articles had the highest median performance at about 2.1K shares.
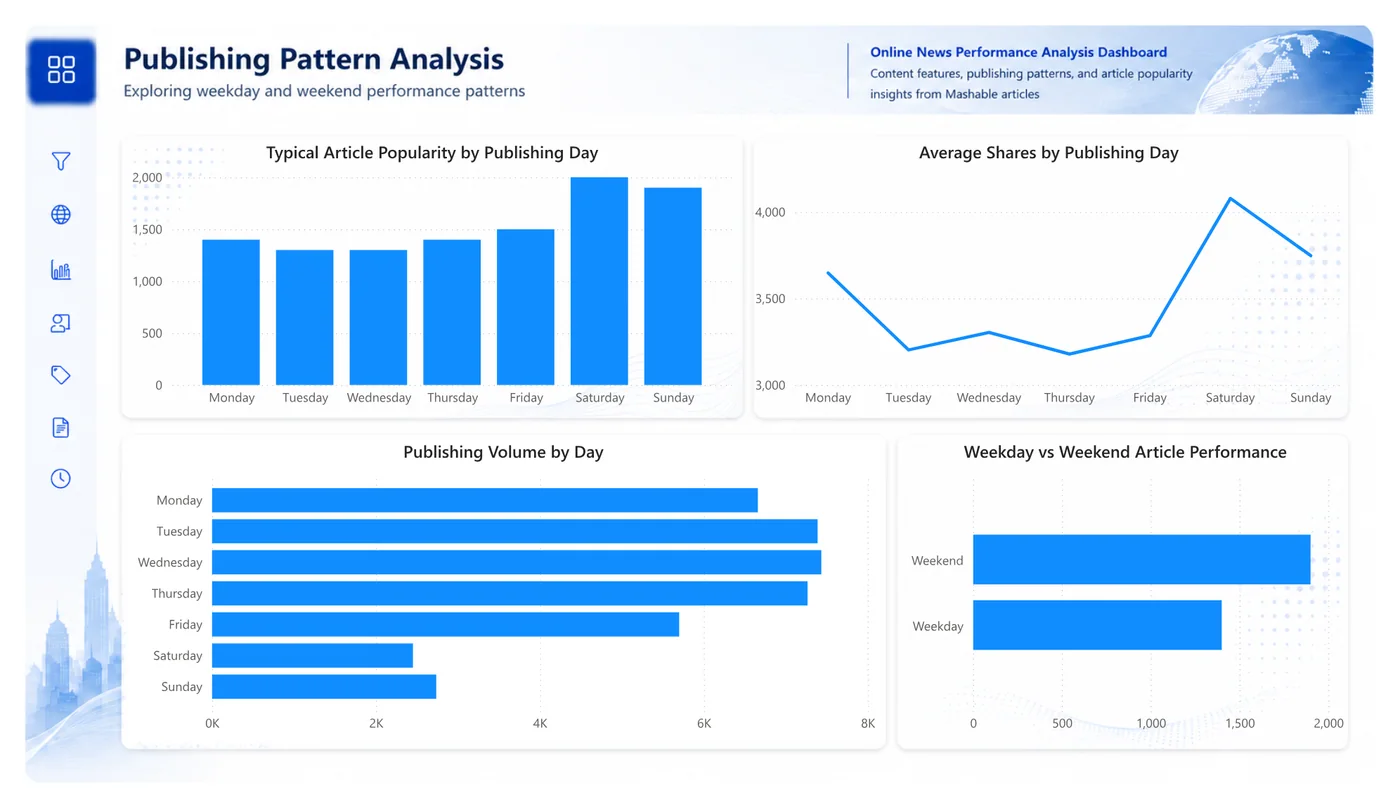
- Saturday and Sunday articles recorded medians of about 2K and 1.9K shares, respectively, despite lower publishing volume.
- The overall median of 1.4K shares is more representative of a typical article than the mean in this long-tailed dataset.
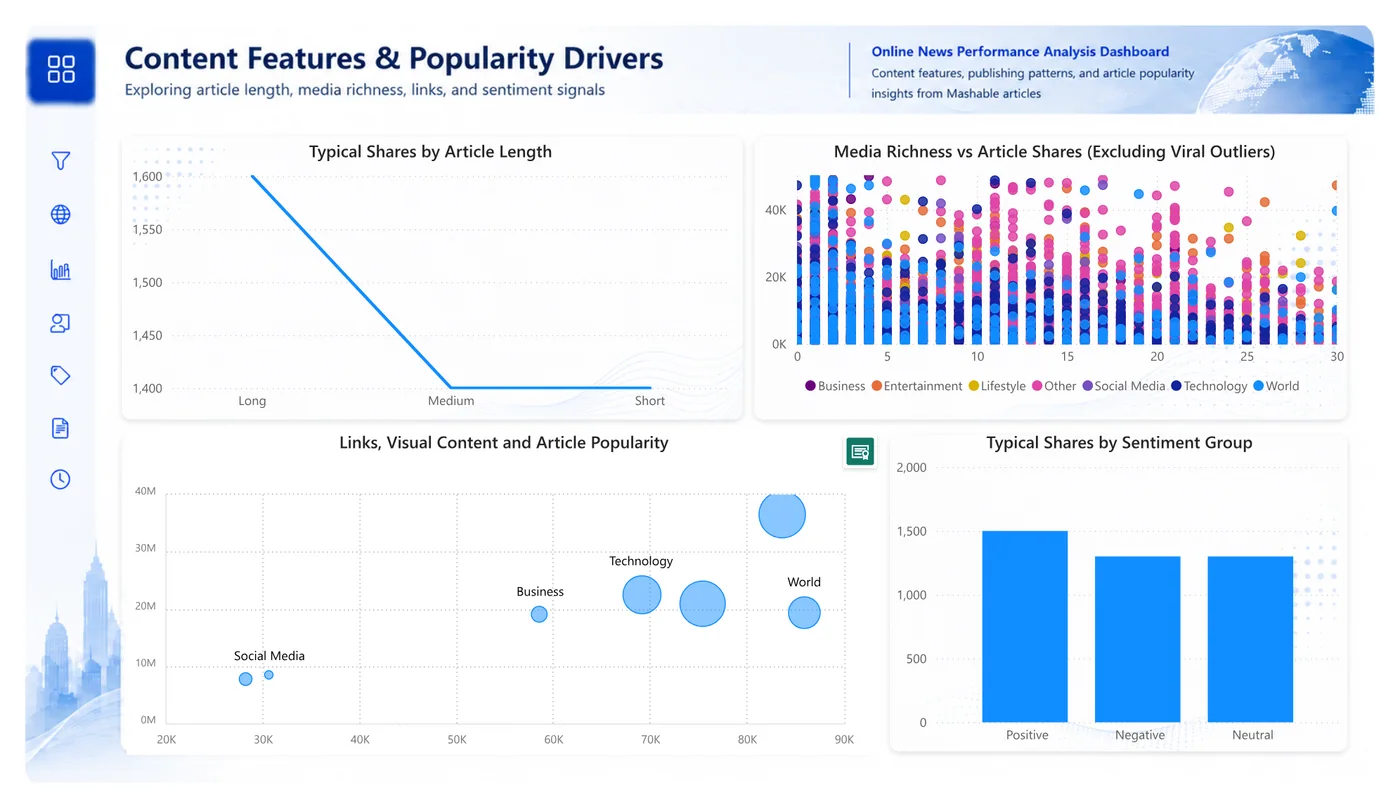
- No single article feature showed a strong relationship with shares. Reach appears to emerge from several interacting editorial and audience conditions.
Interpretation: timing and category are useful planning signals, not guarantees. Editorial experimentation should treat them as hypotheses to test alongside topic quality, distribution, and audience context.
From insight to action
The final report recommends a test-and-learn publishing strategy: protect weekend slots for promising content, continue building social-media coverage, and test combinations of timing, channel, headline, and topic rather than optimising one variable in isolation. A lightweight editorial scorecard could track median shares, consistency, and category mix over time.
The work also makes uncertainty visible. This is an observational dataset, so the patterns support prioritisation and experiments—not causal claims.