The business context
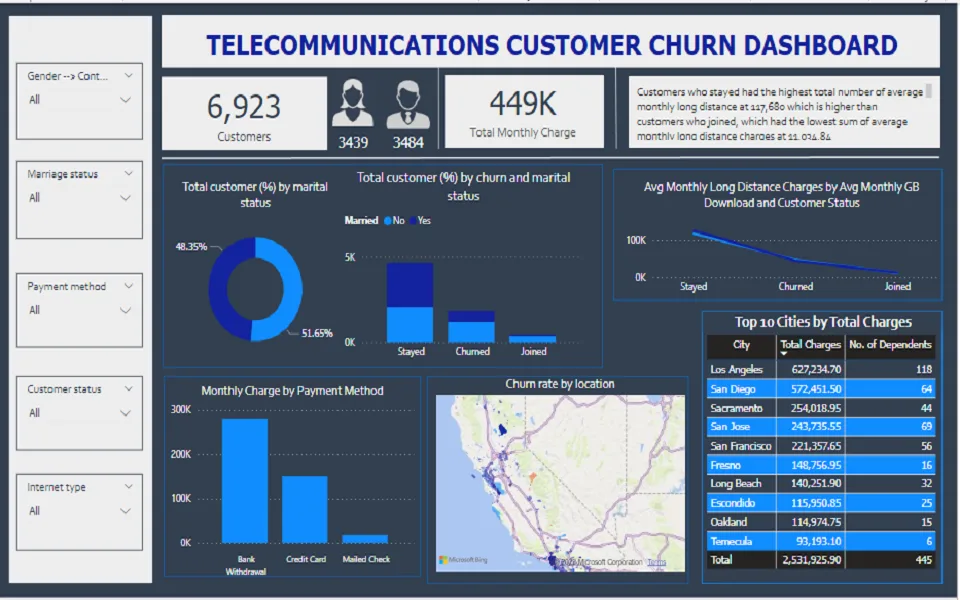
The project used customer data from a telecommunications provider serving California. It covered demographics, geography, phone and internet services, account characteristics, and current customer status for 7,043 people.
Analysis lens
I organised the report around two related needs: understanding which customers represented meaningful value and identifying segments where churn deserved closer attention. Demographic, service, tenure, and account dimensions were brought together so users could move from a headline churn view to more specific comparisons.
Decision value
The dashboard creates a starting point for targeted retention analysis rather than treating every customer or churn event as equivalent. Any operational intervention would require further validation—especially to distinguish descriptive association from causal drivers.