The question
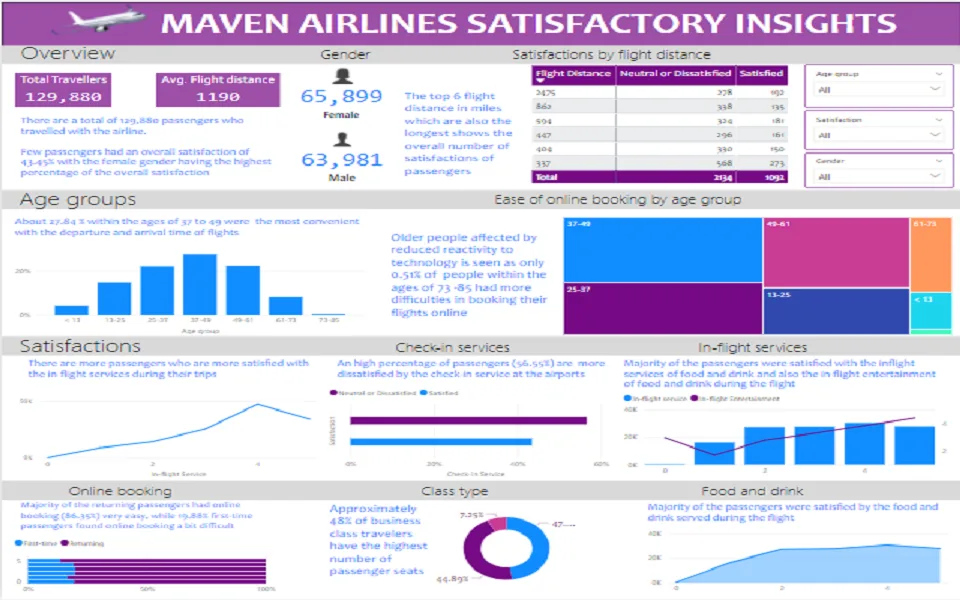
The dataset combined passenger profiles, flight and travel details, and ratings for cleanliness, comfort, service, and the overall experience. The task was to find a clearer basis for a data-informed strategy to increase satisfaction.
Approach
I organised the analysis around traveller segments and service touchpoints, allowing overall satisfaction to be compared across customer type, travel class, purpose, and experience ratings. This helped move the report from a list of scores toward a view of where experience improvements could be concentrated.
What it demonstrates
The project demonstrates early experience handling a large, multi-variable service dataset and translating it into a concise dashboard. It also laid the foundation for my current emphasis on medians, distributions, uncertainty, and carefully bounded recommendations.